




Most small-business ad accounts run on faith. A dashboard says "conversions," the invoice arrives, and nobody can say whether a single dollar produced a single customer. This is the story of how we removed the faith from ours by connecting Claude, Anthropic's AI, directly to our Dothan facility's Google Ads account and its booking data. Claude audited what thirteen months of outsourced management had actually bought, rebuilt the account around ground truth, and now monitors it every morning. In the six weeks that followed, our hardest-to-fill unit size started filling during June and July, the exact peak-season window a storage operator cannot afford to miss.
Everything below is real data from our own account and our own property-management system. We're publishing it because we looked for a write-up like this when we started and couldn't find one.
What "Claude ran our ads" actually means
Let's be precise, because the phrase can hide a lot. We ran Claude (through Claude Code, Anthropic's agent environment) against the Google Ads API. In this project, the AI:
- Ran the entire audit: every finding below came from GAQL queries Claude wrote and executed against the raw account.
- Drafted every fix as a script: each change printed a dry-run preview first, a human approved it, and every change was reversible.
- Wrote and operates the monitoring: a daily digest that pulls spend, clicks, conversions, and live unit inventory, and flags guardrail breaches.
- Joined the data nobody joins: ad spend on one side, move-ins by unit size from our booking system on the other.
What it did not do: place bids in the auction (Google's Smart Bidding does that; Claude's job was fixing what Smart Bidding optimizes toward), or change anything without a human seeing the diff first. AI as the analyst and mechanic, humans holding the keys. That division of labor is the whole trick.
How this started
We began in the first week of June 2026, with timing forced partly by the calendar (peak storage season was starting now) and partly by travel: one of us was about to leave the country. That constraint shaped the architecture. If the machine was going to be rebuilt, it had to run through APIs and automation that could be supervised from anywhere on earth, which is exactly what made an AI operator the natural choice over more hands on a dashboard. By June 10 Claude had full API access to the ad account and had produced a written demand study for the market. By June 12 the facility's website had been rebuilt (also by AI, and that's its own story, with a before/after slider). By June 27 the most important single fix, conversion tracking, was live. Everything in this post happened in those few weeks, on a $12/day media budget.
The starting position
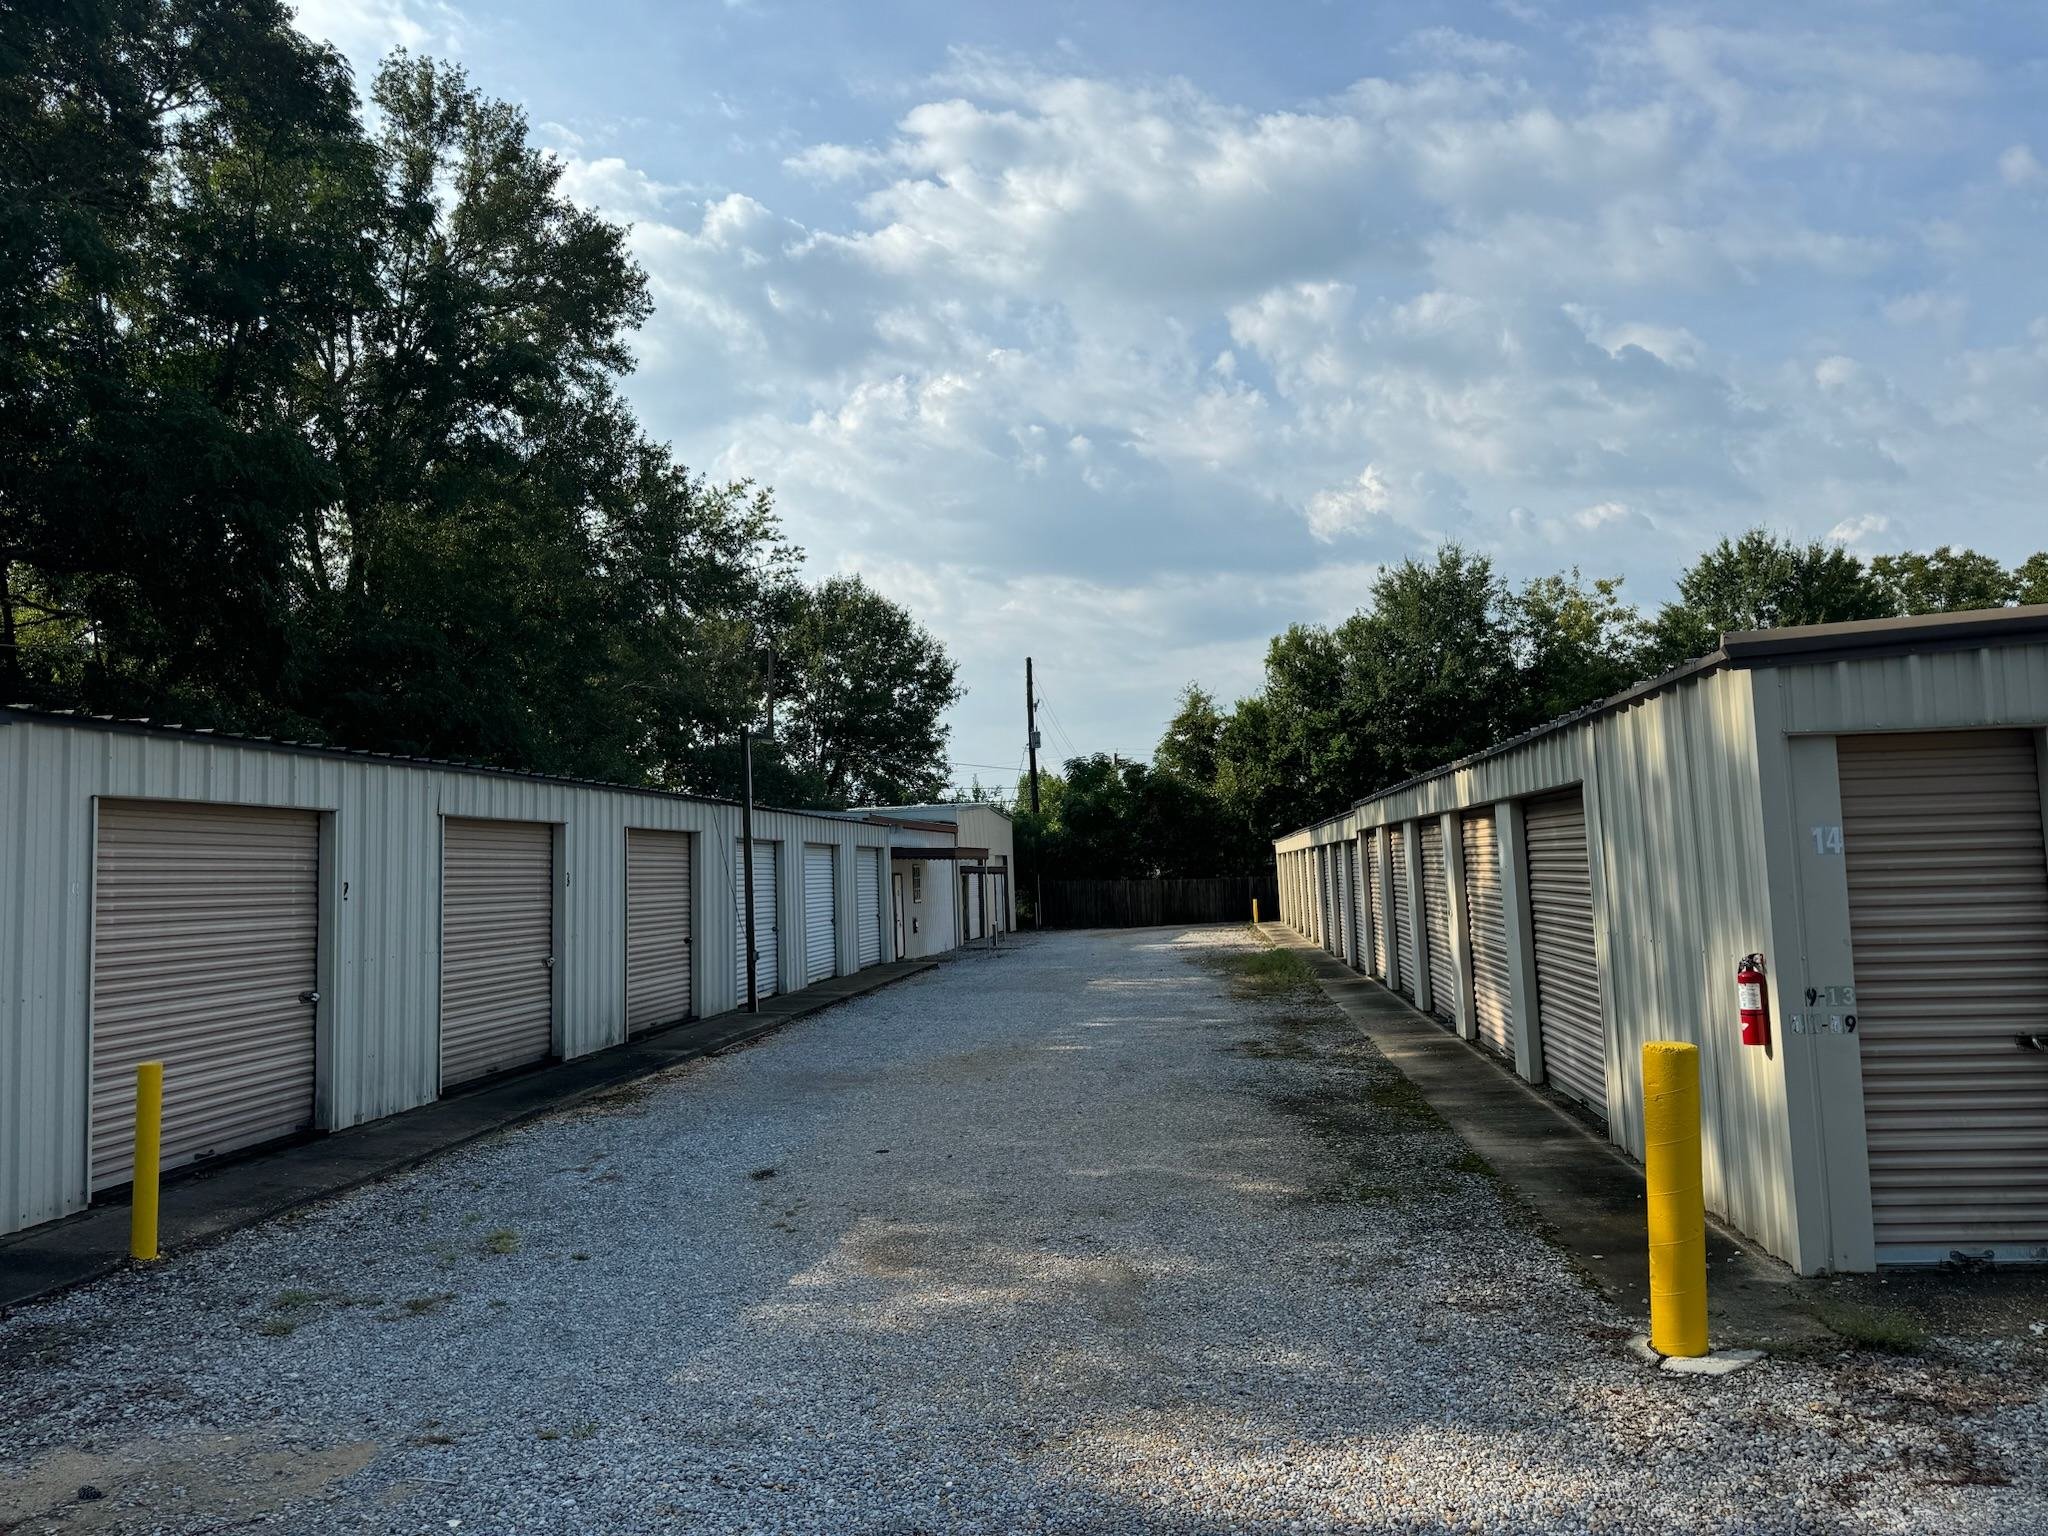
Our Dothan facility at 175 Bob Hall Rd has about 225 spaces across eleven unit types. On June 1, 2026 we were 86.7% occupied overall: respectable, except the vacancy wasn't spread evenly. It was concentrated almost entirely in one size: our 5×10s were half empty (20 of 40 occupied), accounting for roughly 60% of all vacancy on the property.
Storage demand is brutally seasonal. June through August is when households move; November through February is when nothing happens. If we didn't fill 5×10s in June and July, we would be carrying that vacancy through the winter. So the mission was narrow: fill the 5×10s, now, at street rates.
We had a Google Ads account that had been running for thirteen months under an outside freelancer. The obvious question: was it helping?
Step one: give the AI eyes
You cannot audit what you cannot query, and the Google Ads web dashboard shows you what someone configured it to show. So the first move was plumbing, not marketing:
- Google Ads API access. Google now issues "Explorer" developer tokens instantly through any manager account's API Center: production data access, thousands of operations per day, no application process. That's more than enough for an AI to audit and manage a small account.
- Claude, wired to the account. Google ships an official open-source MCP server for the Ads API (MCP is the standard that lets an AI use external tools), and it's read-only by design. Claude could inspect everything and change nothing. Changes went through separate scripts Claude wrote, each printing a dry-run before a human said go.
- A daily digest, written and run by the AI. Every morning it pulls yesterday's spend, clicks, and conversions plus the trailing seven days, and flags guardrail breaches (cost per lead over threshold, zero-impression days, conversion tracking gone quiet).
- The booking system as the source of truth. Our property-management platform knows the only numbers that matter: move-ins, move-outs, and occupancy by unit size, by day. Ad metrics are only ever a proxy; occupancy is the scoreboard. Every claim in this post about occupancy or revenue comes from that system, not from Google.
Step two: the audit. What did thirteen months buy?
Lifetime, the account had spent $3,342 over thirteen months for 754 clicks. Here is what Claude found by querying the raw account, in one afternoon:
- Ads ran Monday–Friday, 8am–3pm local time. That's it. The account's ad schedule was set in the wrong timezone, and covered about 21% of the week's hours, dark every evening and all weekend, which is precisely when people plan moves. Our facility offers 24/7 access; our ads kept banker's hours.
- Desktop bidding was turned off entirely (a −100% device bid adjustment).
- A negative keyword was blocking the region's own vocabulary. Among 394 negative keywords was a phrase-match negative on "mini", which blocks mini storage, the most common colloquial term for self storage across the South. We were paying to advertise storage while excluding the words locals use to search for it. A second negative blocked the name of a neighboring town we actually serve.
- Quality Scores of 2–5 on the money keywords, because five near-identical generic ads all pointed at the homepage. No size-specific keywords existed at all, nothing for "5x10 storage" or "small storage unit", while our vacancy problem was precisely a small-unit problem.
- 39% of recent search-term spend had produced zero conversions of any kind.
- And the big one: the account reported zero conversions, because the one action that mattered was set to "secondary." The click on "Rent Now" (the step that hands a visitor to our online checkout) was being recorded, but it was configured as a secondary conversion action, which excludes it from both the Conversions column and from Smart Bidding. The campaign was running Maximize Conversions with literally nothing defined as a conversion worth maximizing. Thirteen months of machine learning, optimizing toward noise.
None of this is exotic. Every item was sitting in plain sight, in the API. Claude found it
with a handful of GAQL queries: conversion_action (what counts as a conversion; start there, always), ad_schedule plus the account timezone,
search_term_view (what you're really paying for), and keyword_view
with quality-score fields.
Outsourced vs. AI-operated: what actually changed
To be clear about what this post is and isn't: it is not an indictment of freelancers. The person managing this account was working with what the industry considers normal: a small retainer, a web dashboard, no access to our booking system, and no visibility into which unit sizes were sitting empty. The problems above survived for thirteen months not because anyone was careless, but because the standard arrangement structurally hides them: the dashboard reported "conversions" (button clicks), the monthly invoice was modest, and nobody in the loop could join ad spend to occupancy. What changed in June wasn't talent. It was an operator with unlimited patience for raw data, wired to ground truth:
| Outsourced era (May 2025 – May 2026) | AI-operated (June 2026 – ) | |
|---|---|---|
| Visibility | Monthly dashboard summary | Raw API queries + an automated daily digest, joined to occupancy by unit size |
| What counts as a "conversion" | Button clicks, and eventually nothing (the key action was mislabeled secondary) | The checkout handoff as primary; completed move-ins imported back as offline conversions |
| Changes | Occasional, unlogged, invisible to the owner | AI-drafted scripts with a dry-run preview, human-approved, reversible, and logged |
| Goal | "Run the ads" | Fill the 5×10s at street rate before peak season ends |
| Accountability | Cost per lease unknowable (rentals untracked) | Every dollar traceable toward unit-size occupancy |
The trajectory tells the same story. In the outsourced era's final spring, monthly impressions had collapsed from roughly 1,400 to 600 while cost-per-click climbed past $7: the account was quietly shrinking at rising prices, and no one noticed because the dashboard had nothing honest to compare it against. In the first six weeks of AI operation: same modest budget, conversion signal restored, cost-per-click falling, and, below, units actually filling. If you outsource yours, the fix isn't necessarily to fire anyone. It's to demand what we built: a conversion definition tied to revenue, and reporting you can verify against your own books.
Step three: the rebuild
Claude proposed the changes; we approved them; its scripts applied them in deliberate, reversible steps, with no budget increase and no gimmicks. Daily budget stayed a modest $12/day throughout everything described here.
Conversion truth first
- Promoted the rent-checkout click to a primary conversion (June 27) and demoted a duplicate analytics event so nothing double-counts. This single flip is what turned Smart Bidding from blind to sighted.
- Started capturing the Google click ID (gclid) first-party, persisted for 90 days on our own site and attached to every rent and phone click, so completed move-ins can be imported back into Google Ads as offline conversions. The end state: bidding optimizes toward signed rentals, not button clicks.
Then structure
- One Search campaign, Maximize Conversions with a target-CPA guardrail. No Performance Max, no Display, no video. On a $12/day account, broad automated campaign types optimize toward whatever is cheap; plain Search is the only campaign type where intent is provable, so that's the only one we run. (PMax stays off until our offline lease-conversion signal has matured enough to steer it.)
- Intent-themed ad groups instead of one generic blob: a dedicated 5×10 / small units group (the vacancy problem), military & deployment for the Fort Novosel community, brand defense so searches for our own name cost around a dollar instead of being conquested away, and a small competitor conquest group. Responsive search ads rewritten by Claude, reviewed by us, per group, with size- and Dothan-specific headlines.
- Schedule opened to evenings and weekends, desktop re-enabled, the "mini" and neighboring-town negatives removed, and the worst zero-Quality-Score generic keyword ("storage", broad match, the account's single biggest spender) paused.
Where we stand against the incumbents
Google's Auction Insights shows who you actually compete against in the ad auction, not who you think you compete against. Two findings shaped the whole strategy.
First: our real competition on generic terms is aggregators, not other operators. Listing networks (selfstorage.com, storagearea.com, sparefoot.com) take three of the top five impression-share slots in our market. You cannot outbid a national listing network on "storage units near me," and you shouldn't try. We stopped fighting them on generic head terms and put the money into specific, local, high-intent queries.
Second: we were already the impression-share leader, showing up more than anyone, but sitting in the cheap seats. Direct local competitors were consistently above us on the page:
| Advertiser (Dothan auctions) | Impression share | Absolute top-of-page rate | Positioned above us* |
|---|---|---|---|
| Safelock Storage (us) | 32.1% | 17.7% | n/a |
| selfstorage.com (aggregator) | 22.9% | 14.8% | 49% |
| storagearea.com (aggregator) | 22.6% | 18.7% | 54% |
| Storage Rentals of America | 16.5% | 50.4% | 74% |
| sparefoot.com (aggregator) | 14.6% | 15.6% | 47% |
| StoreEase | 11.0% | 47.2% | 77% |
*How often that advertiser's ad showed above ours when we both appeared. All-time Auction Insights, pulled June 28, 2026.
We showed up the most and ranked the worst: the #1 impression share in the market but only 17.7% absolute-top presence, while Storage Rentals of America hit the absolute top spot on half its impressions and out-positioned us 74% of the time. The diagnosis from the API matched: a third of our eligible impressions were being lost to ad rank: a Quality Score problem, not a budget problem. That's why the rebuild above leaned so hard on relevance (tight ad groups, size-specific ads) rather than bids.
The results
The 1,400% in the headline
The cleanest comparison is the fourteen days on either side of the June 27 conversion fix: essentially identical spend, transformed output:
| Jun 14–27 (before) | Jun 28–Jul 11 (after) | |
|---|---|---|
| Spend | $186.97 | $183.32 |
| Impressions | 483 | 626 |
| Clicks | 31 | 33 |
| Conversions (what bidding sees) | 0.5 | 7.5 (+1,400%) |
| Cost per conversion | ~$374 | $24.44 (−93%) |
| Average CPC | $6.03 | $5.56 |
| Impressions lost to ad rank | 34.9% | 21.5% |
An honest note on that headline number: part of that jump is restored measurement (rent-intent clicks that were always happening but counted as nothing) and part is real improvement (impressions up 30%, CPC down 8%, rank losses down thirteen points at identical spend). We're comfortable with the framing because the measurement was the product: a bidding algorithm that sees 0.5 conversions and one that sees 7.5 behave completely differently, and the second one is what fills units. (Fractional conversions are Google's attribution modeling, not a typo.) The constraint has now flipped from rank to budget, which is the constraint you want: it means the account earns more spend rather than begging for it.
The scoreboard that matters: occupancy
From the booking system, not from Google:
| Date | Overall occupancy | 5×10 occupancy (the target) |
|---|---|---|
| June 1, 2026 | 86.7% (195 of 225) | 50% (20 of 40) |
| June 27 (conversion fix ships) | 90.2% | 57.5% (23 of 40) |
| July 4 (peak) | 92.0% (207 of 225) | 60% (24 of 40) |
| July 11 | 91.1% (205 of 225) | 60% (24 of 40) |
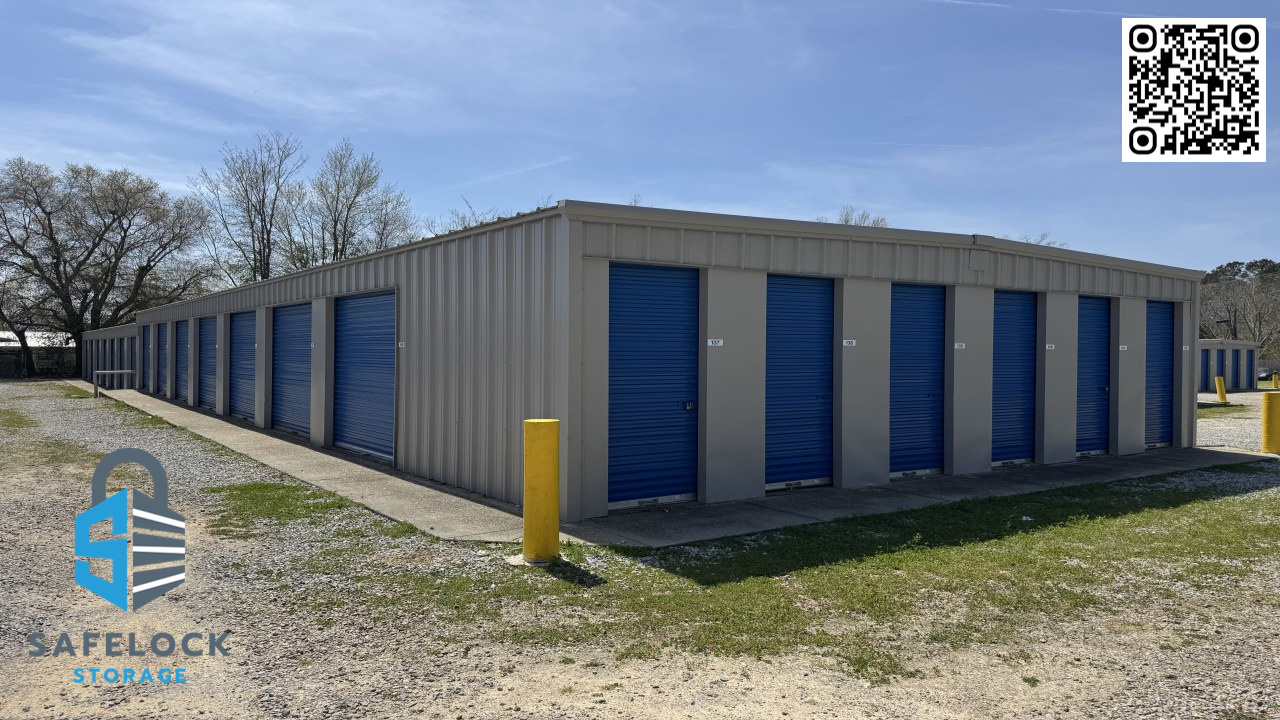
Four 5×10 move-ins between June 19 and July 4, zero 5×10 move-outs, every one at full street rate, with no discounts and no first-month-free. Across all sizes, the six weeks from June 1 to July 11 brought 17 move-ins versus 14 in the same window last year, adding $1,161/month of new rent versus $964 last year, in a facility that was already fuller to begin with. Overall occupancy climbed from 86.7% to a peak of 92%, right through the season that sets up the whole winter.
The return math
Total ad spend for the June 1 – July 11 window was $492.63. Storage rents month-to-month, so for return math we assume a conservative six-month tenancy (industry average stays run longer). Because attribution is never clean, here it is three ways, from the most generous assumption to the most brutal:
| Attribution assumption | 6-month rent | Return on $492.63 |
|---|---|---|
| All 17 move-ins in the window | $6,966 | 14.1× |
| Only the year-over-year increase (+$197/mo) | $1,182 | 2.4× |
| Only the four 5×10 fills (the campaign's target) | $1,128 | 2.3× |
The honest read is between the extremes: paid search was not the only force (June is peak season everywhere, and AI rebuilt the facility's website in the same period; that's its own story), but even the most brutal cut, crediting ads with nothing except the year-over-year delta, pays the entire spend back 2.4 times within six months, before counting that a filled unit tends to stay filled. June's collections came in at $14,280 versus $9,481 the June before (+51%), on the combination of occupancy gains and a rate plan that predates this project.
What we'd tell another operator
- Audit through the API, not the dashboard, and let an AI do it. The dashboard shows what someone configured. Four GAQL queries found every problem in our account in one afternoon, and the AI never got bored reading 394 negative keywords.
- Start with the conversion actions. One mislabeled action (primary vs secondary) made thirteen months of Smart Bidding worthless. It's a single-field fix.
- Your scoreboard is the property-management system. If your ad reporting can't be joined to move-ins by unit size, you're grading your own homework.
- Keep humans on the trigger. Our rule: the AI can read everything, propose anything, and change nothing without a dry-run and an approval. We got the tirelessness of automation without ever betting the account on it.
- If you outsource, change the contract, not necessarily the person. Require conversion definitions tied to revenue, a change log, and numbers you can verify against your own books. The standard arrangement hides problems by default.
- Don't fight aggregators on generic terms. Auction Insights will tell you who actually takes your impressions. Spend where a listing network can't follow: size-specific, neighborhood-specific, honest local queries.
All figures in this post are from our own Google Ads account (via the Google Ads API) and our property-management system, June–July 2026. Auction Insights percentages are Google's own all-time report for our Dothan campaigns. The AI stack: Claude (Anthropic) via Claude Code, Google's official open-source Google Ads MCP server for read-only queries, and human-approved Python scripts for every mutation.